Health Checks - IMP/CUPS - IM & Presence
𝄞 This Is How We Do It 𝄞
And here it is, my list of commands and checks that I run against IM & Presence nodes for most changes that take place. It’s useful output to collect prior to changing configurations like domains, DNS servers, IP/Hostname changes, Upgrades, Restarts – anything that makes a change system wide.
I pull this data to refer back to in the event that the change has disrupted dbrepliction, endpoint registration status, inter-cluster communication, intra-cluster communication, service status, anything. Consider this output a “CYA” for later. Something to refer back to to confirm all is as it was prior to the change, with whatever exceptions should exist (e.g. IP address changes should reflect in post-change “show network eth0 detail” output.)
Health Check Commands [IM&P]
show status
Shows the status of the system, such as system uptime, disk I/O usage, CPU usage, Memory usage, Partition space, Platform version and more.
show version active
Shows the version installed into the active partition as well as any cop files installed.
show version inactive
Shows the version installed into the inactive partition as well as any cop files installed.
show hardware
Shows data relating to the underlying hardware of the system, less pertinent for virtualized servers. In the case of virtualization we would refer to additional ESXi and UCS-C/B/E command output for hardware status.
show network cluster
Returns a list of IP addresses and hostnames/FQDNs for CUC nodes joined to the cluster.
show perf query class Processor|Memory
Query perfmon to review data relating to memory, virtual memory, swap, CPU usage/allocation.
utils diagnose test
Runs self diagnostics on the CUC node itself pertaining to disk, memory, tomcat, DNS, NTP and other functions. Can detect various issues, such as the ever-common “reverse dns lookup failure” and more.
utils service list
| Returns the list of services running on the CUC node, whether it is the Publisher node or not, and what the state of the service is (running | notrunning). |
utils ntp status
Reports back the status of configured NTP servers, what the stratum is currently, and the jitter, and latency is to each.
utils disaster_recovery history backup
Reports back the last 10 (or so) backups, whether they succeeded or failed, what components were backed up and on what date. Also displays what the network device was that was used for SFTP backup.
utils dbreplication runtimestate
Reports back the state of dbreplication AS PER THE LAST STATUS CHECK. This includes the dbreplication state (should be 2), what the replication queue looks like, as well as what nodes are participating in replication.
Replication should be confirmed as ‘healthy’ prior to completing any work. Resolve any replication issues before performing upgrades or other work. To run a fresh status check of dbreplication, issue the command utils dbreplication status
utils core active list
Provides a list of all core files found. Core files are generated whenever a service crashes. These should be analyzed and the backtrace analyzed against open Cisco Bug IDs, or by Cisco TAC.
*To analyze the backtrace of a core file, issue utils core active analyze
utils ha status
Provides the status of High Availability (is it enabled or disabled) as well as the user balance details, similar to checking Presence Redundancy Group in GUI.
utils imdb_replication status
Provides the status of IMDB replication between the IM&P nodes. This is IM&P product data as opposed to base UC VOS replication.
show perf query counter “Cisco XCP CM” “CmConnectedSockets”
This shows the user count for the node you issue the command on.
show perf list instances “Cisco XCP JSM Session Counters”
Lists all users for the IM&P node you issue the command on. If you filter the “Composed” rows and any “Duplicate Users” rows out, the number should match the output for the command including “CmConnectedSockets”.
run pe sql ttlogin select * from clientsessions
Reports back the Jabber Versions being used by the users.
run sql select * from enterprisesubcluster
Reports back the IM&P Redundancy Group configurations from table enterprisesubcluster.
run sql select * from enterprisenode
Reports back IM&P node information and subcluster assignment for the node.
Screenshots
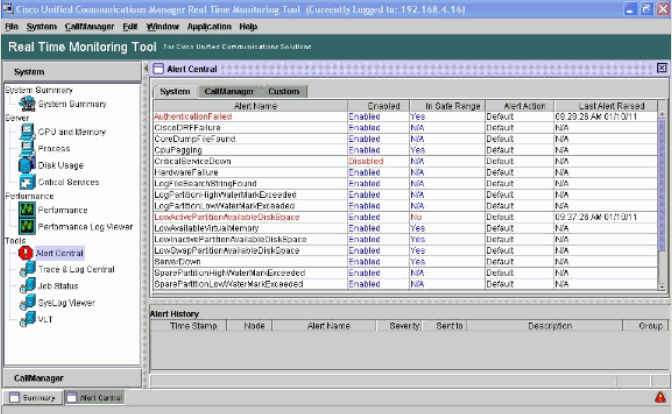
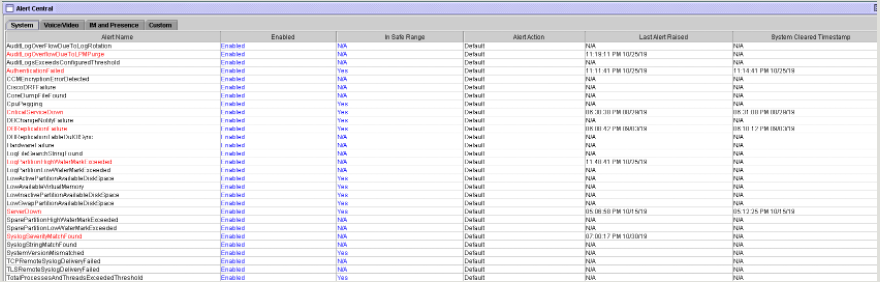
Alert Central - RTMT
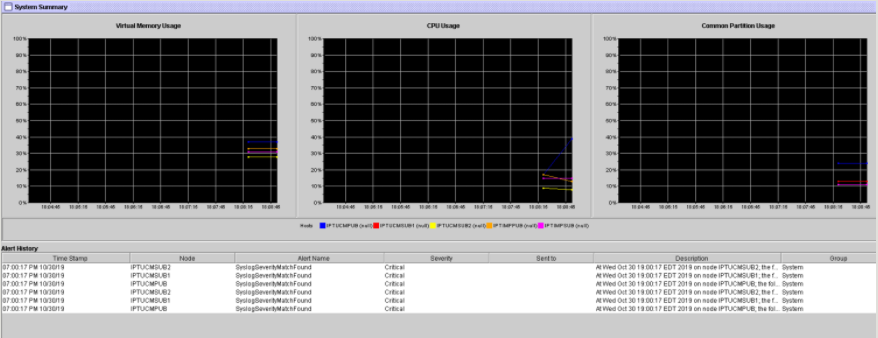
System Summary - RTMT
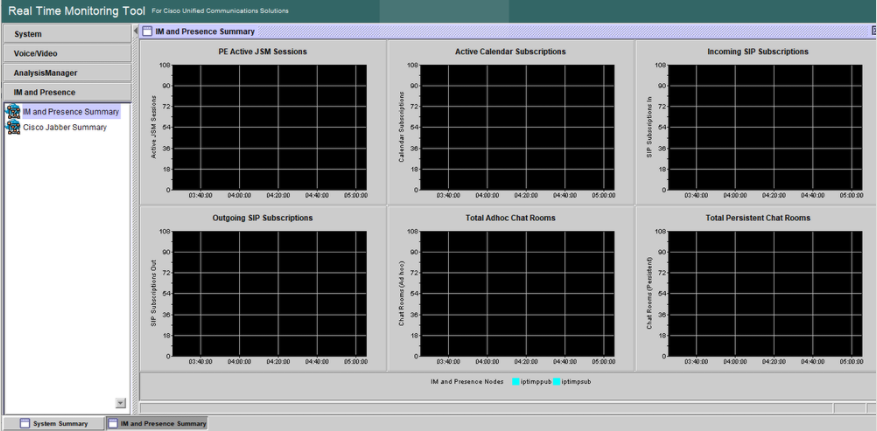
IM&P Summary - RTMT
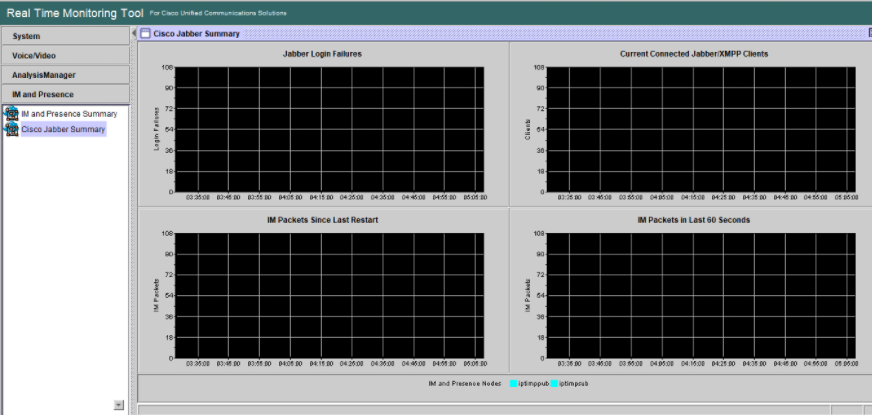
Cisco Jabber Summary - RTMT
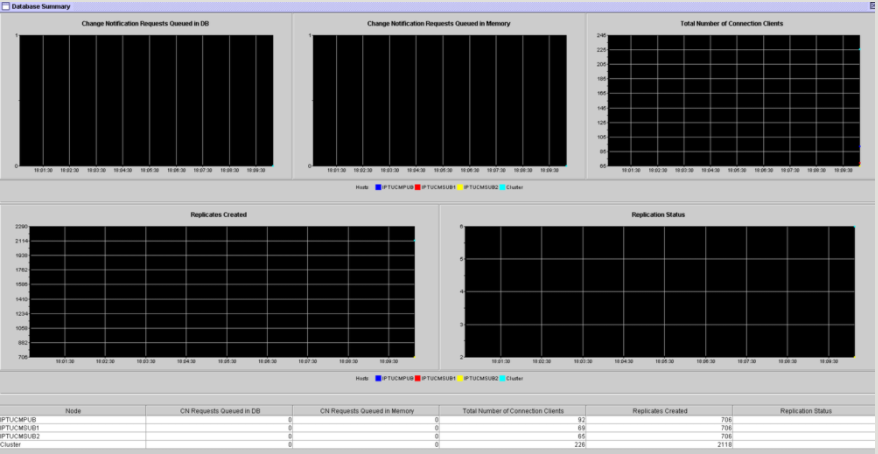
Database Summary - RTMT
For health checks, I don’t download Reports from the Cisco Unified Reporting feature, as it does not contain data that I’d want to refer to for verification. They are however helpful, at times, in troubleshooting issues on the system and getting deeper insights into database replication/setup, for example.
Another useful set of tools are the System Troubleshooter and System Dashboard located under Cisco Unified CM IM and Presence Administration > Diagnostics drop-down menu. Let’s explore them.
System Dashboard - IM&P
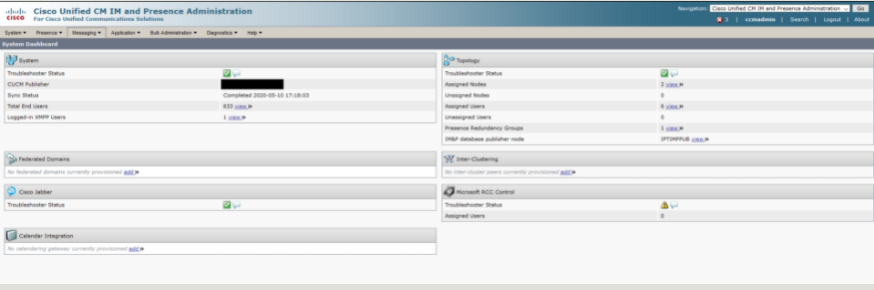
Critical to check for most deployments are the System, Topology, and Cisco Jabber panels. If Inter-Clustering, Federated Domains, Calendar Integration, or Microsoft RCC Control features are used in your environment it is advised to review these panels. The page view is below. The most critical for me to check is that the Troubleshooter Status is a nice green check mark, we don’t have any unassigned nodes and no unassigned users.
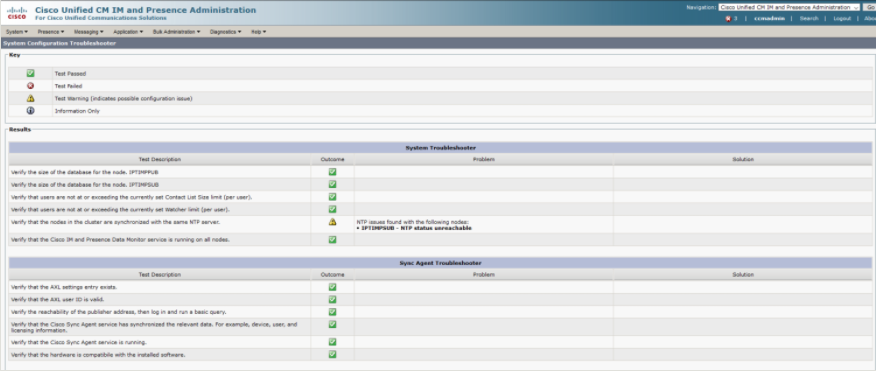
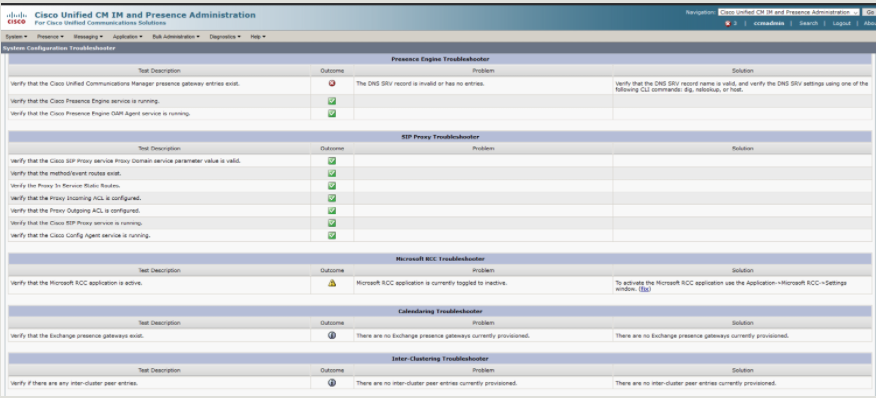
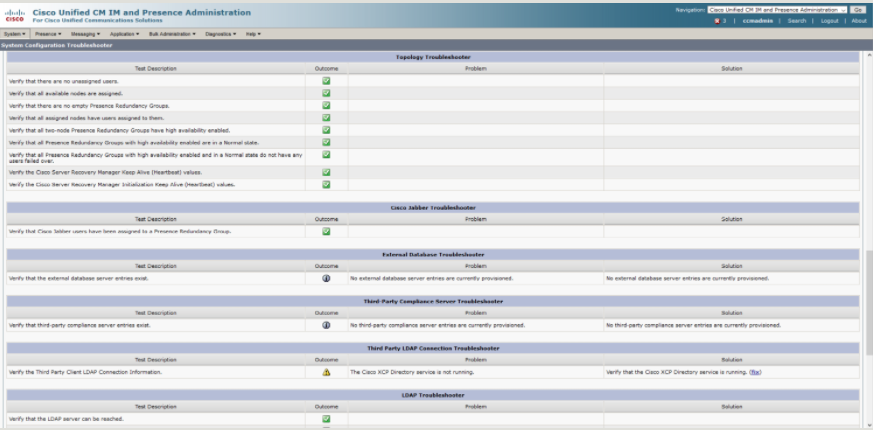
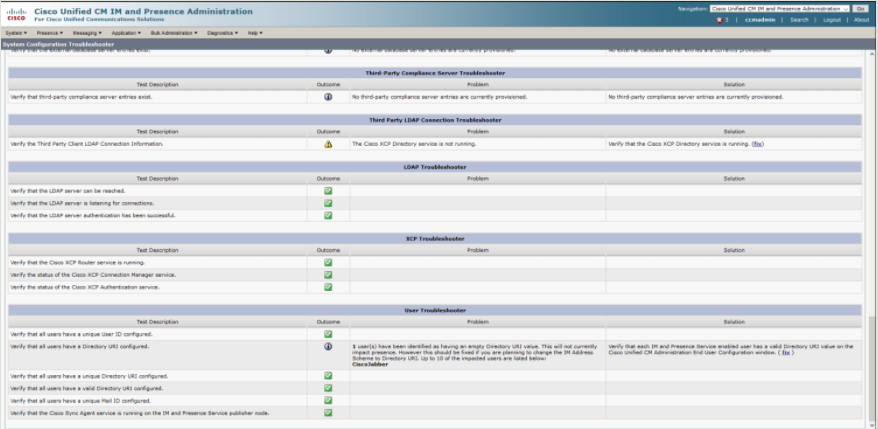
System Troubleshooter - IM&P
The system troubleshooter will initiate a slew of built in tests against the features and services on IM&P and report back what is not working. It won’t exactly tell you what you need to do, but you’ll know where to start looking. As the list is rather expansive I have included screenshots below to give you an idea of what can be reviewed.
System Troubleshooter and Sync Agent Troubleshooter
Presence Engine, SIP Proxy, Microsoft RCC, Calendaring and Inter-Clustering Troubleshooter
Topology, Cisco Jabber, External Database, 3rd Party Compliance & LDAP Connection Troubleshooter
LDAP, XCP, and User Troubleshooter
I hope this list of checks is useful the next time you implement changes, upgrades, reboots or other impactful work on your Cisco IM&P deployment. Understanding the state of your system before a change (and documenting it well) will allow you to more quickly spot problems on the other side. If you have any steps I’ve neglected here, please feel free to let me know! I’m always looking to expand my skillset and knowledge of useful commands and tools! Well, that’s it for now! Make sure to follow the blog to get alerts on new posts, check out the social links, or NOC Thoughts Discord!